I just finished reading Principles for Dealing with the Changing World Order – Why Nations Succeed and Fail by Ray Dalio. Mr. Dalio states:
“Dealing with the future is all about 1) perceiving and adapting to what is happening, even if it can’t be anticipated; 2) coming up with probabilities for what might happen; and 3) knowing enough about what might happen to protect oneself against the unacceptable, even if one can’t do that perfectly.”
I recently spent a weekend in the historic mining town of Leadville, Colorado, and marveled at the riches-to-rags story of Horace and “Baby Doe” Tabor. They became one of the richest couples in the wild, wild west during the 1880s when the dollar was backed by silver. Mr. Tabor grubstaked miners and was fortunate enough to have grubstaked claims to three rich silver deposits. In 1893, the Sherman Silver Purchase Act of 1890 was repealed under President Grover Cleveland, and the silver market crashed. The Tabors failed to diversify and died paupers.
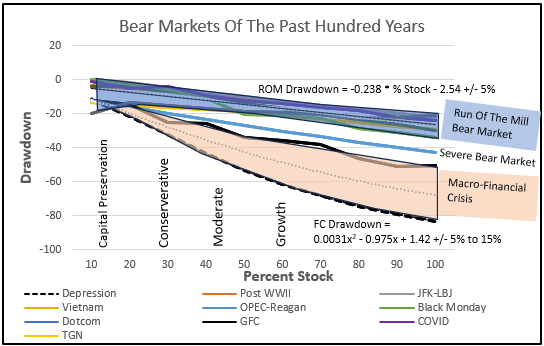
Figure #1 shows the bear markets of the past one hundred years by allocation to stocks. The run-of-the-mill bear markets (blue shaded area) are usually associated with mild to moderate recessions. The area between the Great Financial Crisis starting in late 2007 and the Great Depression of the 1930s (burnt orange shading) reflects performance during the two severe macro-financial crises. The severe Dotcom bear market located between the two shaded areas was the result of high stock valuations.
Figure #1: Portfolio Drawdowns During Bear Markets of the Past 100 Years
Source: Author using MFO Premium fund screener and Lipper global dataset.
100 Years of Debt Cycles, Gold Prices, and Currency Devaluation
The bear markets of the past one hundred years are a story that includes debt cycles, financial crises, inflation, and currency devaluation. The Gold Reserve Act of 1934 effectively devalued the dollar by changing the statutory gold content of the U.S. Dollar from $20.67 to $35 an ounce. In 1971, President Richard Nixon ended international convertibility of the dollar to gold. The dollar became a fiat currency.
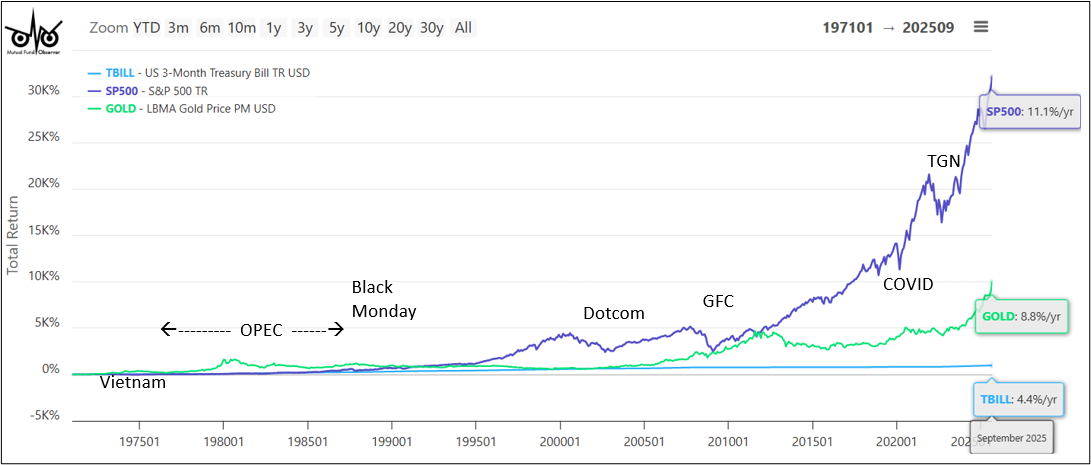
Figure #2 shows how gold performed against stocks and Treasury Bills for the fifty-four-year period since the U.S. left the gold standard. Stocks, including dividends, have outperformed gold, but there are three notable periods when gold has performed as well or better than stocks: 1) the 1970s, 2) 2000 – 2011, and 3) the past two years.
Figure #2: Large Cap Stock and Gold Performance – 54 Years
Source: Author using MFO Premium fund screener and Lipper global dataset.
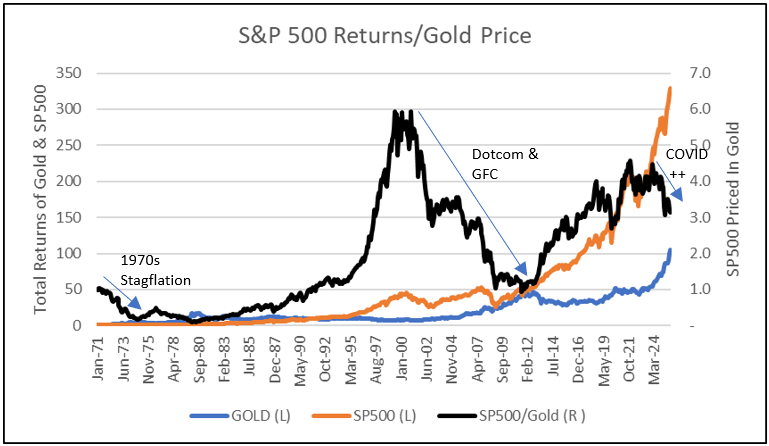
Mr. Dalio wrote, “Most people worry about whether their assets are going up or down; they rarely pay much attention to the value of their currency.” Figure #3 shows the growth of $1 invested in each of gold and the S&P500 on January 1st, 1971. The black line shows the returns of the S&P 500 when priced in gold. Inflation and currency devaluations lowered the purchasing power of investments in stocks. In addition, gold deposits have gotten deeper and lower grade over time, making gold more expensive to produce. Stock prices are high relative to gold, so gold may again be a hedge against high valuations.
Figure #3: Total Stock Returns Priced in Gold
Source: Author using MFO Premium fund screener and Lipper global dataset.
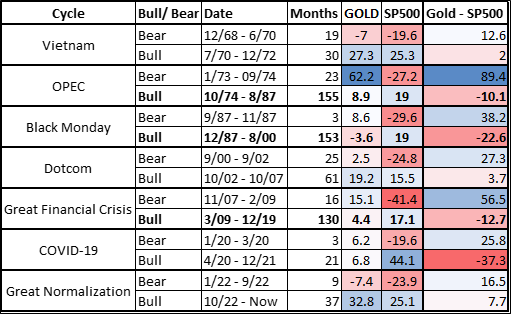
Table #1 compares the changes in the price of gold to returns on stocks during stock market bull and bear markets for the past fifty-eight years. The key take aways are: 1) gold outperforms stocks in every bear market, 2) gold had positive price increases in all but two bear markets, 3) gold outperformed stocks in three of the seven bull markets, 4) gold outperformed stocks by the widest margin during the inflationary OPEC bear market and Great Financial Crisis, and 5) stocks outperformed gold by the widest margin during long periods of relative stability.
Table #1: Gold Performance During Stock Market Cycles
Source: Author using MFO Premium fund screener and Lipper global dataset.
Asset Universe
This article uses indexes available through the MFO Premium fund screener and Lipper global dataset to interpret how portfolios would have performed during the Great Depression. By the start of the Great Financial Crisis, there were 61 alternative funds, 53 dedicated short funds, and 55 equity leverage funds that have survived to today. Currently, there are over a thousand alternative and trading funds that have nearly $700B in assets under management. My point is that many of these funds have not been tested under severe market conditions, and some of these financial innovations will lead to amplified volatility and losses.
The Great Depression
Figure #4 shows how portfolios of stocks and government bonds would have performed following the 1929 crash. Portfolios with stock-to-bond ratios ranging from 20% to 60% would have recovered in four to seven years, while an all-stock portfolio would not have recovered before World War II started.
Figure #4: Portfolio Performance During the Great Depression
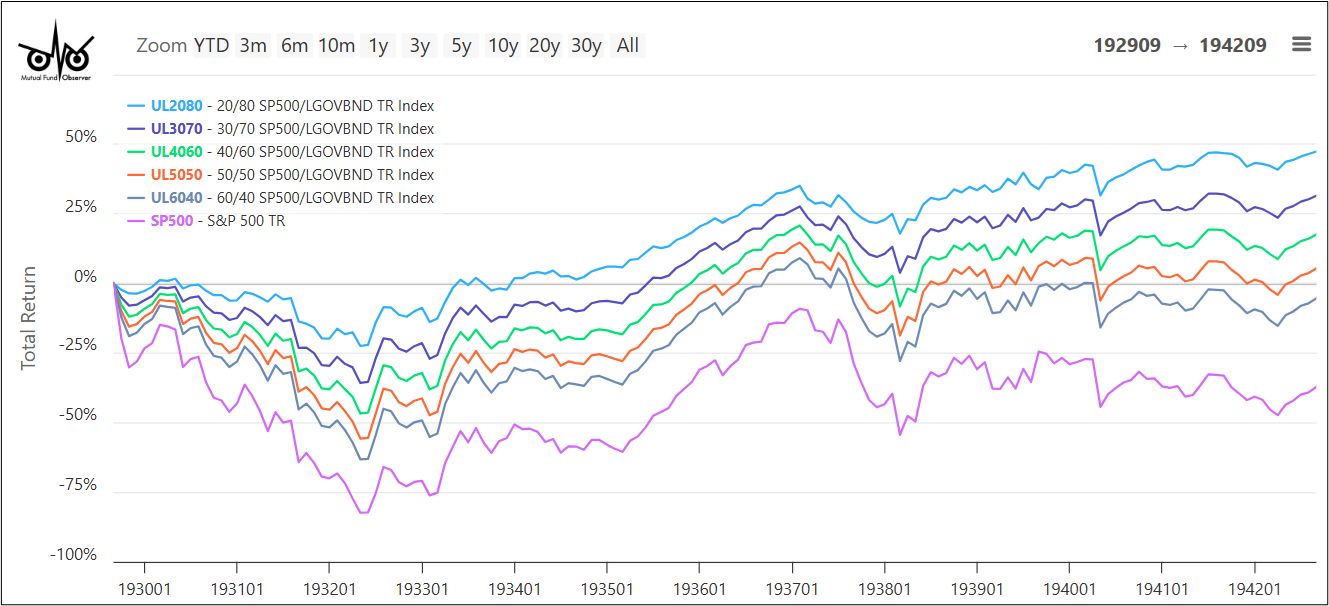
Source: Author using MFO Premium fund screener and Lipper global dataset.
To prevent depressions like the 1930s, the Securities and Exchange Commission (SEC) was created to regulate the stock market, the Federal Reserve was realigned to more effectively provide liquidity, the FDIC was created by the Banking Act of 1933 to insure bank deposits, and Social Security and unemployment insurance were established to provide a safety net.
Post WWII Period (Jun 1946 – Dec 1961)
Gross federal debt at the end of the war was 120% of GDP. The real GDP grew at an annual rate of 3.5%. By 1961, the gross federal debt had been lowered to 50%, largely by growing our way out of debt. Figure #5 shows portfolio performance during the post-WWII period.
Figure #5: Portfolio Performance During the Post-WWII Period
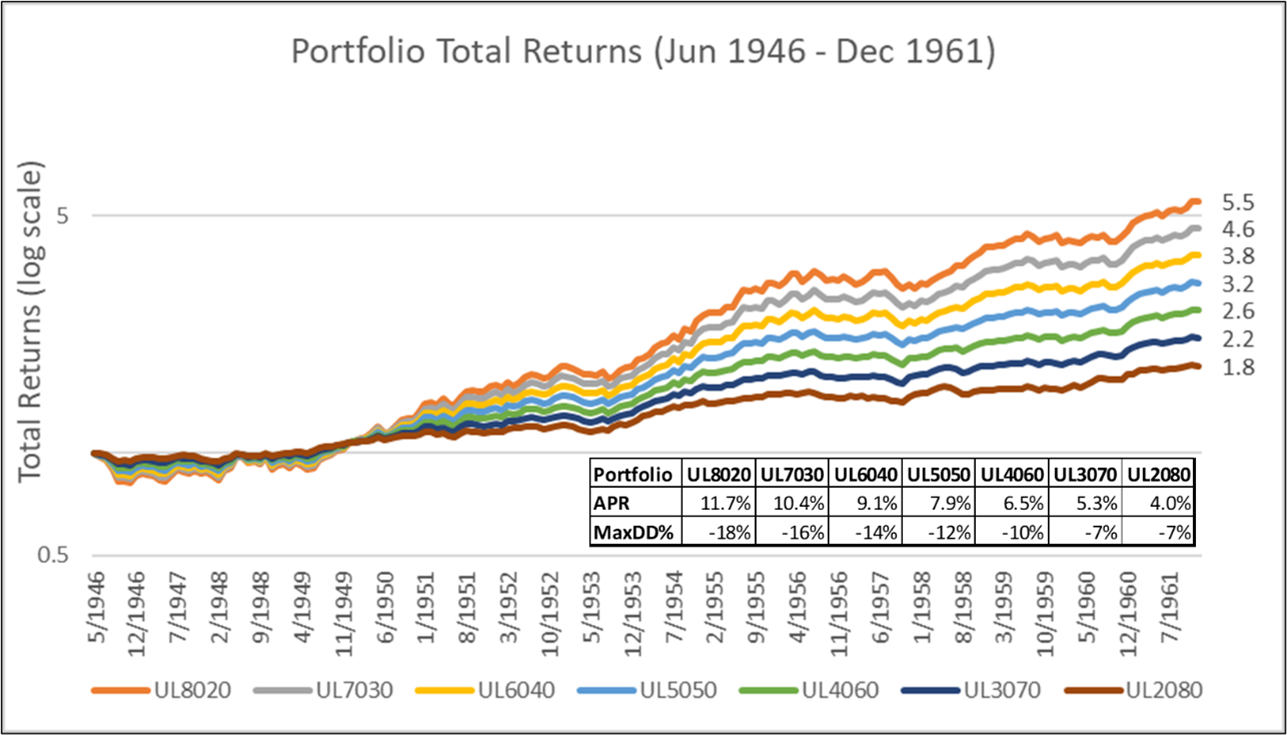
Source: Author using MFO Premium fund screener and Lipper global dataset.
The Secular Bear Market of the 1970s
The OPEC embargo occurred at the end of the Vietnam War, and inflation rose to 11% by 1974 before falling 6% in 1976. The Iranian revolution brought a second energy crisis in 1979. Federal budget deficits began to rise in 1974 and reached -3.8% by 1982. Paul Vocker eventually “breaking the back of inflation” in 1982
Mutual funds were available during this time, and mixed-asset funds usually had a stock-to-bond allocation of about 60/40. Figure #6 shows that most mixed asset funds would have performed about as well as a large-cap core equity fund such as American Funds Investment Company of America (AIVSX). However, most did not beat inflation. Bonds did not provide much protection during this period of high inflation.
Figure #6: Portfolio Performance During the 1970s Stagflation
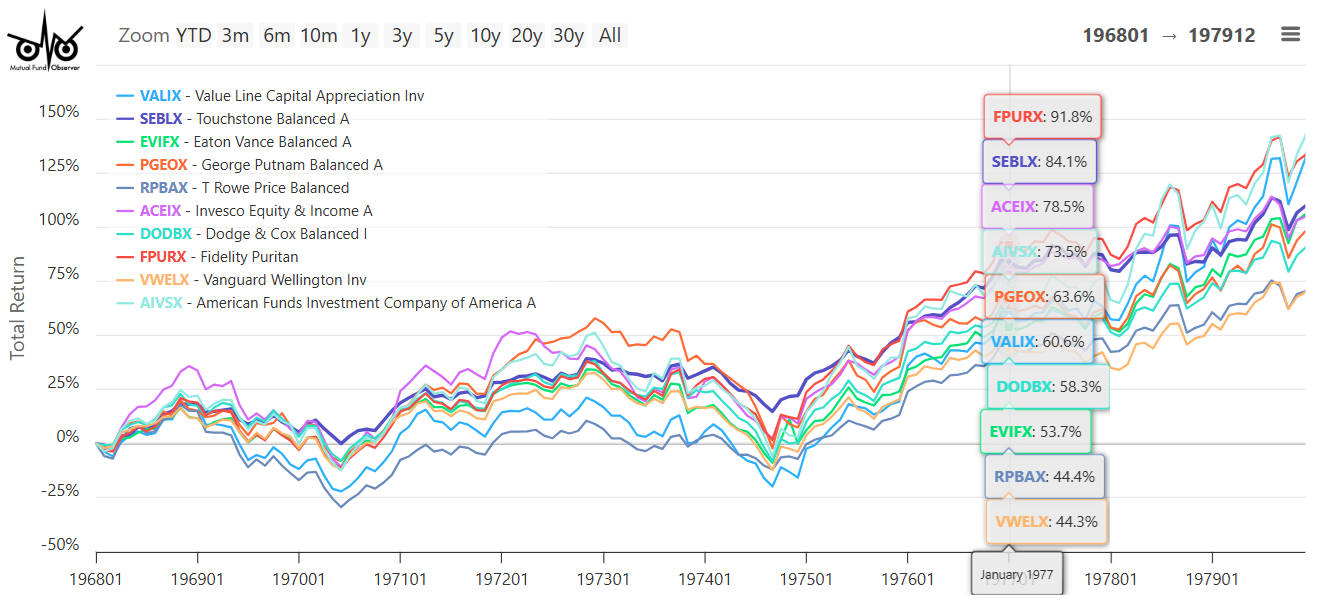
Source: Author using MFO Premium fund screener and Lipper global dataset.
Figure #7 shows that commodities and gold were the places to invest during this period, but they can be very volatile.
Figure #7: Gold and Commodities for Inflation and Uncertainty
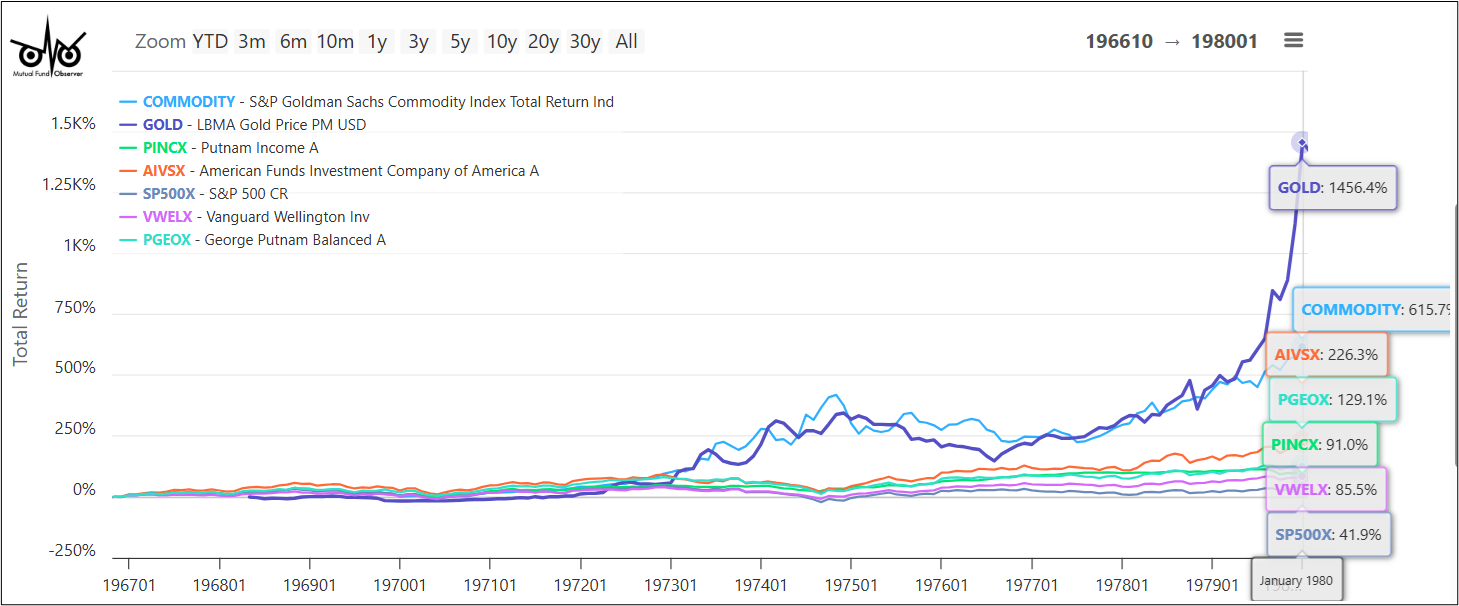
Source: Author using MFO Premium fund screener and Lipper global dataset.
The average price of gold had a low of $138 in 1977 and rose to over $670 in 1980, with the real (inflation-adjusted) yield on the 10-year Treasury falling to zero. The real yield climbed to over 6% in 1981, providing an alternative to gold. The Federal deficit was rising and reached nearly -6% as a percent of GDP in 1983. By 1985, gold had fallen back to only $312 per ounce.
Savings And Loan Crisis and the Fabulous Decade
Approximately a third of the savings and loan associations failed during the ten years starting in 1986, leading to the Black Monday bear market in 1987. Gold rose from a low of $338 in 1986 to a high of $465 in 1988. The stock bull market after Black Monday climbed for nearly thirteen years, with stocks rising on average 19% per year while gold fell 3.6% annually on average. The decade of the 1990s became known as the Fabulous Decade. During this age of globalization from 1986 through 1999, real GDP grew at 3.3%. In 1987, the deficit to GDP ratio was -3% but reached a surplus for the three years starting in 1999. The real yield on ten-year Treasuries averaged 4.4% for the thirteen-year period. Federal Reserve Chairman Alan Greenspan warned of “irrational exuberance” in 1996. It was a prelude to the Dotcom bear market.
The DOTCOM and Great Financial Crisis Secular Bear Market
The severity of the Dotcom bear market was the result of high valuations and was only associated with a mild recession. The Great Financial Crisis was a macro-financial crisis in which extreme fiscal and monetary policies were employed to avoid a 1930s-style depression. Figure #8 shows that conservative mixed asset funds protected on the downside while growth-oriented mixed-asset funds provided long-term growth. Both beat the S&P 500 during this twelve-year period in part because of the concentration of technology stocks in the S&P 500. Commodities fell hard during the financial crisis.
Figure #8: Fund Performance During the Dotcom – GFC Secular Bear
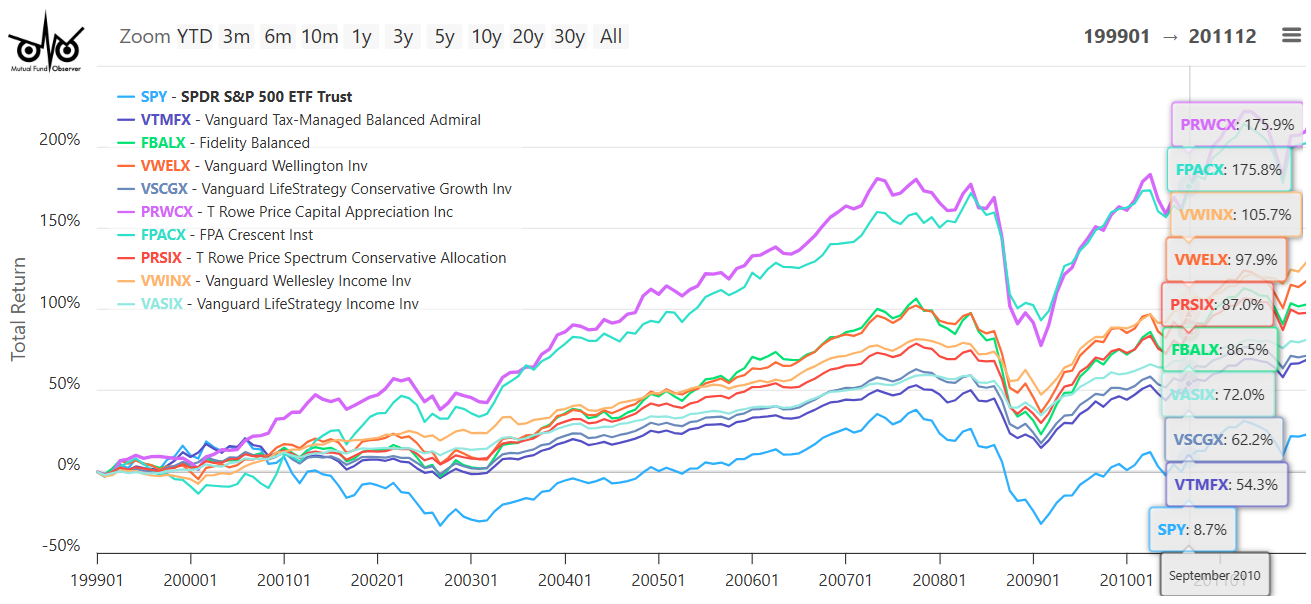
Source: Author using MFO Premium fund screener and Lipper global dataset.
Great Financial Crisis to the Present
For the twenty-seven years since 1999, real GDP has grown at a slower annual rate of 2.2%. The total gross Federal debt as a percent of gross domestic product has risen from 55% prior to the Dotcom bear market to 90% at the end of the Great Financial Crisis to 105% prior to the COVID pandemic, and again sits at high levels similar to the end of WWII.
Gold averaged $280 per ounce in 1999. It then rose steadily to $1,700 at the end of 2012 for an increase of over 600% during the twelve-year period. There were many factors that may have contributed to the rise: The bombing of the World Trade Center occurred in 2001, 2) the war in Afghanistan in (2001 – 2021), war in Iraq (2003 to 2011), the European debt crisis (2010 – 2012), the real yield on 10-year Treasuries declining, current account balance including trade deficit has been negative for almost the entire period, Quantitative Easing added over two trillion dollars to the financial system, the dollar fell by 27%, and World GDP averaged 7% growth so more affluent investors could buy gold.
I downloaded 623 funds in 97 Lipper Categories that have been in existence for the past twenty years. Figure #9 shows the average risk-free return versus the downside deviation of twenty-seven Lipper Categories over the past two decades. Those between the two blue lines have had high risk-adjusted returns. Notice that precious metals (gold) also had high risk-adjusted returns. The laggards like international, small-cap, and natural resources now have low valuations and high momentum, and I expect them to perform better in the coming decade. Notice that U.S. Treasury General funds have had lower risk-adjusted returns.
Figure #9: Risk-Free Return vs Downside Drawdown – Two Decades
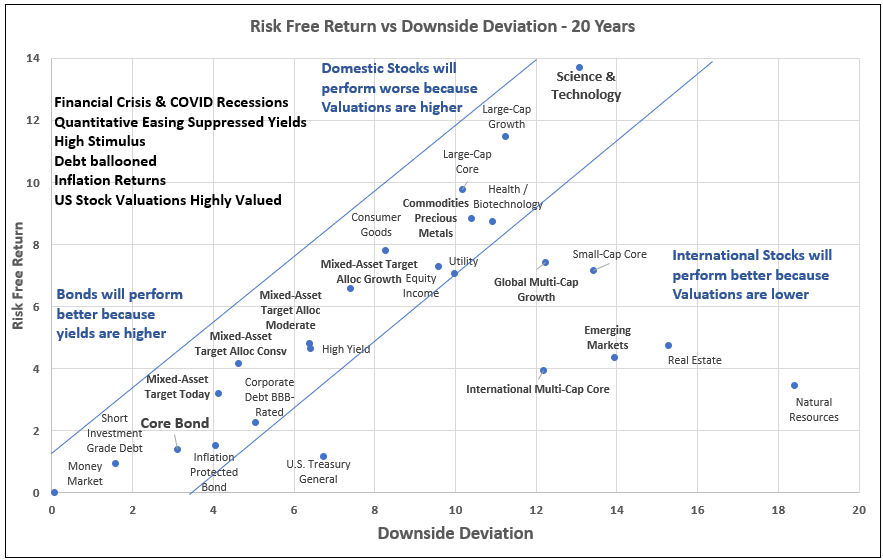
Source: Author using MFO Premium fund screener and Lipper global dataset.
Closing
I spent three decades in the gold mining industry, and did not invest in gold because my livelihood was already impacted by the price of gold. Now that I am retired, I believe that gold is overbought in the short term, but has long-term potential as a hedge against a future crisis and currency devaluation. I made a small purchase of iShares Gold Trust (IAU), and plan to add to the position.
The cautionary warning from Mr. Dalio is:
“To review, holding debt as an asset that provides interest is typically rewarding early in the long-term debt cycle when there isn’t a lot of debt outstanding, but holding debt late in the cycle, when there is a lot of debt outstanding, and it is closer to being defaulted on or devalued, is risky relative to the interest rate being offered.”


![[Web dev for beginners] CSS: Learn the essentials quickly](/image/r?src=templates/thedailycurrents.com/v8/images/categories/17.jpg&w=825&h=520&zc=1)
![[Web dev for beginners] CSS: Learn the essentials quickly](/image/r?src=templates/thedailycurrents.com/v8/images/categories/18.jpg&w=825&h=520&zc=1)